| |
 |
|
Python |
10.3 Graphs:
US Capitals |
|
10.3.1 Example Graph
Using Lists: US Capitals:
Graphs in Python are most frequently represented using dictionaries
and sets for the adjacency lists. For simplicity I been using lists only.
The example below is from Knuth (Vol 3).
| n | US
Capitals, with distanced between them |
|---|
| | Class
Graph (file: graph.py) |
Build caps graph
(file: caps.py) |
capsdata1.txt | capsdata2.txt |
|---|
 1
 2
 3
 4
 5
 6
 7
 8
 9
10
11
12
13
14
15
16
17
18
19
20
21
22
23
24
25
26
27
28
29
30
31
32
33
34
35
36
37
38
39
40
41
42
43
44
45
46
47
48
49
50
51 |
# graph.py: class giving adjacency list graph
import sys

class Graph(object):
    def __init__(self):
        self._numV = 0 # num of vertices
        self._g = []
    # insert/put stuff ###############
    def insertVertex(self, d=None):
        self._numV += 1
        self._g.append([d, []])
    def insertEdge(self, u, v, d=None):
        self._g[u][1].append([v,d]);
    def putVertexData(self, v, d):
        self._g[v][0] = d
    def putEdgeData(self, u, v, d):
        # assumes unique edges
        for w in self._g[u][1]:
            if w[0] == v:
                w[1] = d
                return
    # get stuff ######################
    def getNumV(self):
        return self._numV
    def getVertexData(self, u):
        return self._g[u][0]
    def getEdgeData(self, u, v):
        for w in self._g[u][1]:
            if w[0] == v:
                return w[1]
        return None
    def getAdjList(self, u, d):
        ret = []
        if u < 0 or u >= self._numV:
            return None
        elif len(self._g[u][1]) == 0:
            return None
        else:
            t = len(self._g[u][1])
            for i in range(0,t):
                if self._g[u][1][i][1] == d:
                    ret.append(self.\
                      _g[u][1][i][0])
            return ret
    # print stuff ####################
    def printGraph(self):
        sys.stdout.write("g = [\n")
        for i in range(len(self._g)):
            sys.stdout.write(str(self._g[i])
              + ", # " + str(i) + '\n')
        sys.stdout.write("]\n")
| # caps.py: 48 US capitals
import sys
import re
from graph import *
# construct graph
g = Graph()
r = re.compile(r"(\d+)\s+\[\"([A-Z][A-Z])\",\
\s+(\d+),\s+(\d+)\]" )
f = open("capsdata1.txt",'r')
for line in f:
m = r.search(line)
if m != None:
i = int(m.group(1))
state = m.group(2)
x = int(m.group(3))
y = int(m.group(4))
entry = [ state, x, y]
g.insertVertex(entry)
r = re.compile(r"(\d*)\s*(\d*)\s*(\d*)" )
f = open("capsdata2.txt",'r')
for line in f:
m = r.search(line)
if m != None:
i = int(m.group(1))
j = int(m.group(2))
d = int(m.group(3))
g.insertEdge(i, j, d)
g.insertEdge(j, i, d)
# testing
sys.stdout.write(str(g.getEdgeData(2,6))+'\n')
g.putEdgeData(2,6,444)
sys.stdout.write(str(g.getEdgeData(2,6))+'\n')
g.putVertexData(4, ['Arizona', 3, 3])
sys.stdout.write(str(g.getVertexData(4))+'\n')
g.printGraph()
| 0 ["CA", 1, 4]
1 ["NV", 2, 4]
2 ["OR", 2, 5]
3 ["WA", 2, 6]
4 ["AZ", 3, 3]
5 ["UT", 3, 4]
6 ["ID", 3, 5]
7 ["NM", 4, 3]
8 ["CO", 4, 4]
9 ["WY", 4, 5]
10 ["MT", 4, 6]
11 ["TX", 5, 2]
12 ["OK", 5, 3]
13 ["KS", 5, 4]
14 ["NE", 5, 5]
15 ["SD", 5, 6]
16 ["ND", 5, 7]
17 ["LA", 6, 2]
18 ["AR", 6, 3]
19 ["MO", 6, 4]
20 ["IA", 6, 5]
21 ["MN", 6, 6]
22 ["MS", 7, 2]
23 ["IL", 7, 5]
24 ["WI", 7, 6]
25 ["AL", 8, 2]
26 ["TN", 8, 3]
27 ["KY", 8, 4]
28 ["IN", 8, 5]
29 ["MI", 8, 6]
30 ["FL", 9, 1]
31 ["GA", 9, 2]
32 ["VA", 9, 3]
33 ["WV", 9, 4]
34 ["OH", 9, 5]
35 ["SC", 10, 1]
36 ["NC", 10, 2]
37 ["MD", 10, 4]
38 ["PA", 10, 5]
39 ["DE", 11, 4]
40 ["NJ", 11, 5]
41 ["NY", 11, 6]
42 ["VT", 11, 7]
43 ["CT", 12, 5]
44 ["MA", 12, 6]
45 ["NH", 12, 7]
46 ["RI", 13, 5]
47 ["ME", 13, 7]
| 0 4 755
0 1 129
0 2 535
1 4 713
1 5 534
1 6 541
1 2 663
2 6 441
2 3 160
3 6 619
4 7 476
4 5 652
5 8 488
5 9 435
5 6 338
6 9 727
6 10 438
7 11 697
7 12 585
7 8 355
8 12 626
8 13 536
8 14 486
8 9 100
9 14 444
9 15 455
9 10 675
10 15 742
10 16 624
11 17 430
11 18 504
11 12 388
12 18 337
12 19 416
12 13 293
13 19 204
13 14 165
14 19 343
14 20 187
14 15 392
15 20 490
15 21 404
15 16 215
16 21 435
17 22 150
17 18 416
18 22 253
18 26 344
18 19 340
19 26 453
19 27 562
19 23 192
19 20 255
20 23 291
20 24 279
20 21 244
21 24 258
22 25 242
22 26 392
23 27 415
23 28 190
23 24 249
24 29 614
25 30 205
25 31 160
25 26 282
26 31 255
26 36 530
26 32 597
26 27 203
27 32 532
27 33 197
27 34 186
27 28 145
28 34 175
28 29 244
29 34 237
30 31 252
31 35 212
31 36 434
32 36 156
32 37 129
32 33 302
33 37 397
33 38 354
33 34 160
34 38 425
35 36 200
37 39 62
37 38 103
38 39 124
38 40 127
38 41 268
39 40 108
40 41 193
41 43 111
41 44 165
41 42 153
42 44 236
42 45 106
43 46 72
43 44 101
44 46 45
44 45 68
45 47 139
|
| n | Internal
form of Graph (file:
us_graph_rep.py)
|
|---|
441
444
['Arizona', 3, 3]

g = [
[['CA', 1, 4], [[4, 755], [1, 129], [2, 535]]], # 0
[['NV', 2, 4], [[0, 129], [4, 713], [5, 534], [6, 541], [2, 663]]], # 1
[['OR', 2, 5], [[0, 535], [1, 663], [6, 444], [3, 160]]], # 2
[['WA', 2, 6], [[2, 160], [6, 619]]], # 3
[['Arizona', 3, 3], [[0, 755], [1, 713], [7, 476], [5, 652]]], # 4
[['UT', 3, 4], [[1, 534], [4, 652], [8, 488], [9, 435], [6, 338]]], # 5
[['ID', 3, 5], [[1, 541], [2, 441], [3, 619], [5, 338], [9, 727], [10, 438]]], # 6
[['NM', 4, 3], [[4, 476], [11, 697], [12, 585], [8, 355]]], # 7
[['CO', 4, 4], [[5, 488], [7, 355], [12, 626], [13, 536], [14, 486], [9, 100]]], # 8
[['WY', 4, 5], [[5, 435], [6, 727], [8, 100], [14, 444], [15, 455], [10, 675]]], # 9
[['MT', 4, 6], [[6, 438], [9, 675], [15, 742], [16, 624]]], # 10
[['TX', 5, 2], [[7, 697], [17, 430], [18, 504], [12, 388]]], # 11
[['OK', 5, 3], [[7, 585], [8, 626], [11, 388], [18, 337], [19, 416], [13, 293]]], # 12
[['KS', 5, 4], [[8, 536], [12, 293], [19, 204], [14, 165]]], # 13
[['NE', 5, 5], [[8, 486], [9, 444], [13, 165], [19, 343], [20, 187], [15, 392]]], # 14
[['SD', 5, 6], [[9, 455], [10, 742], [14, 392], [20, 490], [21, 404], [16, 215]]], # 15
[['ND', 5, 7], [[10, 624], [15, 215], [21, 435]]], # 16
[['LA', 6, 2], [[11, 430], [22, 150], [18, 416]]], # 17
[['AR', 6, 3], [[11, 504], [12, 337], [17, 416], [22, 253], [26, 344], [19, 340]]], # 18
[['MO', 6, 4], [[12, 416], [13, 204], [14, 343], [18, 340], [26, 453], [27, 562], [23, 192], [20, 255]]], # 19
[['IA', 6, 5], [[14, 187], [15, 490], [19, 255], [23, 291], [24, 279], [21, 244]]], # 20
[['MN', 6, 6], [[15, 404], [16, 435], [20, 244], [24, 258]]], # 21
[['MS', 7, 2], [[17, 150], [18, 253], [25, 242], [26, 392]]], # 22
[['IL', 7, 5], [[19, 192], [20, 291], [27, 415], [28, 190], [24, 249]]], # 23
[['WI', 7, 6], [[20, 279], [21, 258], [23, 249], [29, 614]]], # 24
[['AL', 8, 2], [[22, 242], [30, 205], [31, 160], [26, 282]]], # 25
[['TN', 8, 3], [[18, 344], [19, 453], [22, 392], [25, 282], [31, 255], [36, 530], [32, 597], [27, 203]]], # 26
[['KY', 8, 4], [[19, 562], [23, 415], [26, 203], [32, 532], [33, 197], [34, 186], [28, 145]]], # 27
[['IN', 8, 5], [[23, 190], [27, 145], [34, 175], [29, 244]]], # 28
[['MI', 8, 6], [[24, 614], [28, 244], [34, 237]]], # 29
[['FL', 9, 1], [[25, 205], [31, 252]]], # 30
[['GA', 9, 2], [[25, 160], [26, 255], [30, 252], [35, 212], [36, 434]]], # 31
[['VA', 9, 3], [[26, 597], [27, 532], [36, 156], [37, 129], [33, 302]]], # 32
[['WV', 9, 4], [[27, 197], [32, 302], [37, 397], [38, 354], [34, 160]]], # 33
[['OH', 9, 5], [[27, 186], [28, 175], [29, 237], [33, 160], [38, 425]]], # 34
[['SC', 10, 1], [[31, 212], [36, 200]]], # 35
[['NC', 10, 2], [[26, 530], [31, 434], [32, 156], [35, 200]]], # 36
[['MD', 10, 4], [[32, 129], [33, 397], [39, 62], [38, 103]]], # 37
[['PA', 10, 5], [[33, 354], [34, 425], [37, 103], [39, 124], [40, 127], [41, 268]]], # 38
[['DE', 11, 4], [[37, 62], [38, 124], [40, 108]]], # 39
[['NJ', 11, 5], [[38, 127], [39, 108], [41, 193]]], # 40
[['NY', 11, 6], [[38, 268], [40, 193], [43, 111], [44, 165], [42, 153]]], # 41
[['VT', 11, 7], [[41, 153], [44, 236], [45, 106]]], # 42
[['CT', 12, 5], [[41, 111], [46, 72], [44, 101]]], # 43
[['MA', 12, 6], [[41, 165], [42, 236], [43, 101], [46, 45], [45, 68]]], # 44
[['NH', 12, 7], [[42, 106], [44, 68], [47, 139]]], # 45
[['RI', 13, 5], [[43, 72], [44, 45]]], # 46
[['ME', 13, 7], [[45, 139]]], # 47
]
|
10.3.2 Alternative
version of the US Caps graph:
Here is a version of the class Graph already initialized to give the graph
of the US Capitals:
| Graph class
initialized to give US capitals (file:
graph.py)
|
|---|
# graph.py: 48 US capitals
import sys

class Graph(object):
    def __init__(self):
        self._numV = 48 # num of vertices
        self._g = [
[['CA', 1, 4], [[4, 755], [1, 129], [2, 535]]], # 0
    ( 45 lines omitted -- see above)
[['RI', 13, 5], [[43, 72], [44, 45]]], # 46
[['ME', 13, 7], [[45, 139]]], # 47
]
    # insert/put stuff ###############
    def insertVertex(self, d=None):
        self._numV += 1
        self._g.append([d, []])
    def insertEdge(self, u, v, d=None):
        self._g[u][1].append((v,d));
    def putVertexData(self, v, d):
        self._g[v][0] = d
    def putEdgeData(self, u, v, d):
        # assumes unique edges
        for w in self._g[u][1]:
            if w[0] == v:
                w[1] = d
                return
|
    # get stuff ######################
    def getNumV(self):
        return self._numV
    def getVertexData(self, u):
        return self._g[u][0]
    def getEdgeData(self, u, v):
        for w in self._g[u][1]:
            if w[0] == v:
                return w[1]
        return None
    def getAdjList(self, u, d):
        ret = []
        if u < 0 or u >= self._numV:
            return None
        elif len(self._g[u][1]) == 0:
            return None
        else:
            t = len(self._g[u][1])
            for i in range(0,t):
                if self._g[u][1][i][1] == d:
                    ret.append(self.\
                      _g[u][1][i][0])
            return ret
    # print stuff ####################
    def printGraph(self):
        sys.stdout.write("g = [\n")
        for i in range(len(self._g)):
            sys.stdout.write(str(self._g[i])
              + ", # " + str(i) + '\n')
        sys.stdout.write("]\n")
|
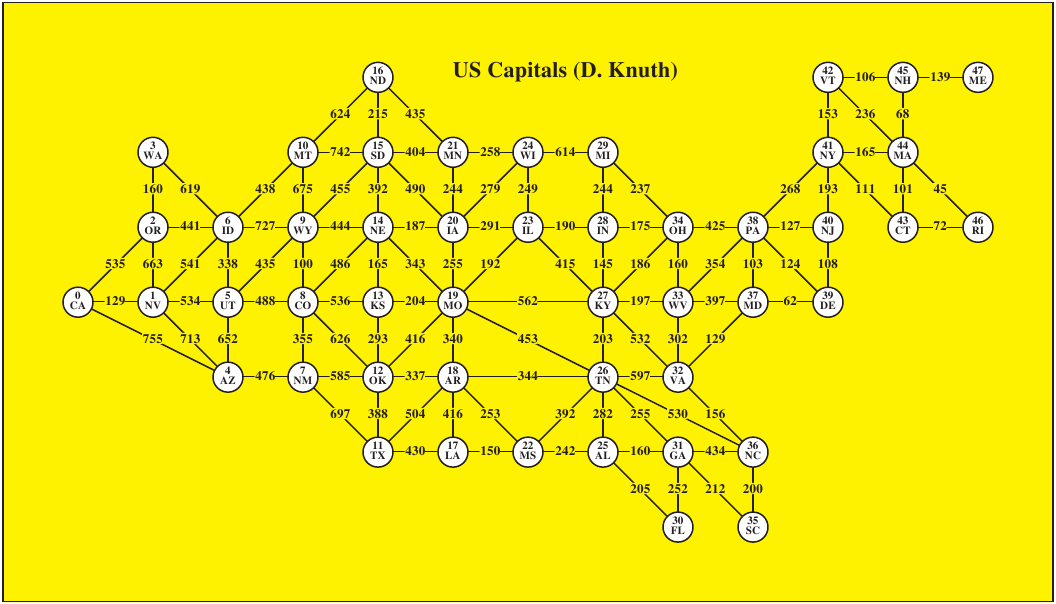
10.3.3 Postscript
picture of this graph: In the code below, I'm "cheating": directly
using the list representation of the US capitals graph, rather than using
a class. This is easier to work with, but it is not safe, and
requires the use of subscripts into the list g.
| Generate
Postscript code to display graph |
|---|
# caps_draw.py: 48 US capitals
import sys

# caps graph:
g = [
[['CA', 1, 4], [[4, 755], [1, 129], [2, 535]]], # 0
[['NV', 2, 4], [[0, 129], [4, 713], [5, 534], [6, 541], [2, 663]]], # 1
    ( 43 lines omitted -- see above)
[['NH', 12, 7], [[42, 106], [44, 68], [47, 139]]], # 45
[['RI', 13, 5], [[43, 72], [44, 45]]], # 46
[['ME', 13, 7], [[45, 139]]], # 47
]
fout = open("caps_draw.ps",'w')
def genf(infile): # output Postscript files
    f = open(infile, 'r')
    for line in f:
        fout.write(line)
genf("caps_draw_pre.ps")

def trans(u):
    return g[u][0][1], g[u][0][2]

for i in range(0,48):
    for node in g[i][1]:
        if i < node[0]:
            fout.write(str(trans(i)[0]) + " " + str(trans(i)[1]) + " ")
            fout.write(str(trans(node[0])[0]) +  " " +
               str(trans(node[0])[1]) + ' ' + str(node[1]) +' zlineto ')
            fout.write("% " + str(i) + ' ' + str(node[0]) + "\n")

for i in range(0,48):
    fout.write(str(i) + ' ' +str(g[i][0][1]) + ' ' +
      str(g[i][0][2]) + ' (' + g[i][0][0] + ") drawnode")
    if i%2 == 1:
        fout.write('\n')
    else:
        fout.write('  ')

genf("caps_draw_post.ps")
|
|
|
|
caps_draw.pdf
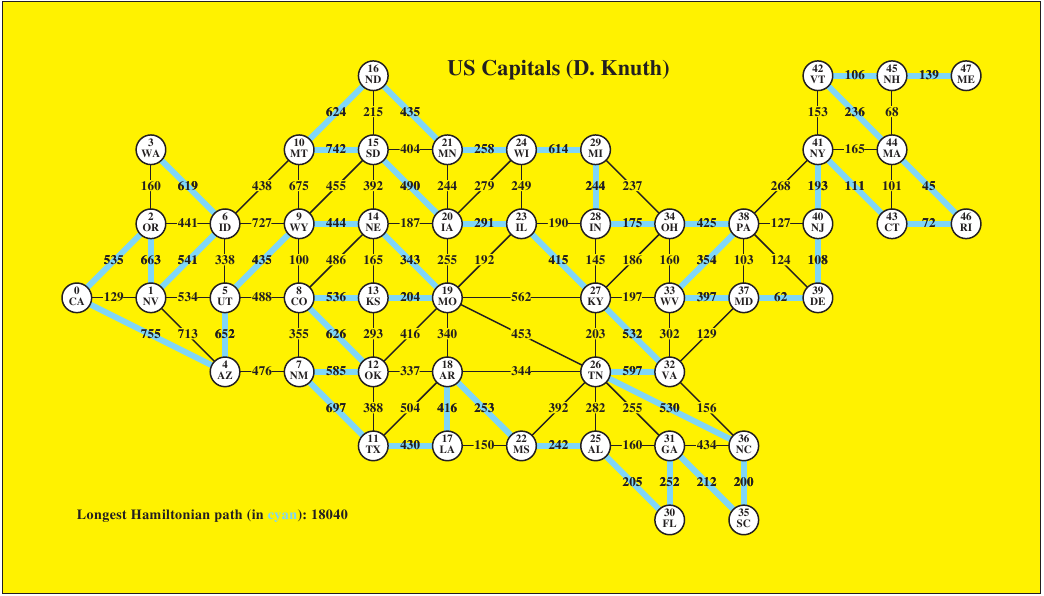
10.3.4 Postscript
picture with a path:
Here I add a picture of a path through the graph. There are two
examples below, each a Hamiltonian path (a path including each
vertex exactly once).
There are 68 656 026 distinct Hamiltonian
paths in this graph. I'm including the longest one and the shortest
one. These were computed in Java using backtracking search:
Hamiltonian Paths. That program would port to Python, but
would take a long time to compute the same paths.
| Python program
to generate Postscript code to display graph |
|---|
# caps_draw.py: 48 US capitals
import sys

# caps graph:
g = [
[['CA', 1, 4], [[4, 755], [1, 129], [2, 535]]], # 0
[['NV', 2, 4], [[0, 129], [4, 713], [5, 534], [6, 541], [2, 663]]], # 1
    ( 43 lines omitted -- see above)
[['NH', 12, 7], [[42, 106], [44, 68], [47, 139]]], # 45
[['RI', 13, 5], [[43, 72], [44, 45]]], # 46
[['ME', 13, 7], [[45, 139]]], # 47
]
fout = open("caps_draw2.ps",'w')
def genf(infile): # output Postscript files
    f = open(infile, 'r')
    for line in f:
        fout.write(line)

genf("caps_draw_pre.ps")

def trans(u):
    return g[u][0][1], g[u][0][2]

for i in range(0,48):
    for node in g[i][1]:
        if i < node[0]:
            fout.write(str(trans(i)[0]) + " " +
              str(trans(i)[1]) + " ")
            fout.write(str(trans(node[0])[0]) +
               " " + str(trans(node[0])[1]) +
               ' ' + str(node[1]) +' zlineto ')
            fout.write("% " + str(i) + ' '
              + str(node[0]) + "\n")

fout.write("Red 0.08 setlinewidth\n")
|
# longest possible Hamiltonian path
p = [47, 45, 42, 44, 46, 43, 41, 40, 39, 37,
     33, 38, 34, 28, 29, 24, 21, 16, 10, 15,
     20, 23, 27, 32, 26, 36, 35, 31, 30, 25,
     22, 18, 17, 11,  7, 12,  8, 13, 19, 14,
      9,  5,  4,  0,  2,  1,  6,  3]

def lookup(u,v):
    for node in g[u][1]:
        if node[0] == v:
            return node[1]

for i in range(0,47):
    fout.write(str(trans(p[i])[0]) + ' ' +
      str(trans(p[i])[1]) + ' ' +
      str(trans(p[i+1])[0]) + ' ' +
      str(trans(p[i+1])[1]) + ' ' +
      str(lookup(p[i], p[i+1])) + ' ' +
      "wlineto\n")

fout.write("0.02 setlinewidth Black\n")

for i in range(0,48):
    fout.write(str(i) + ' ' +
      str(g[i][0][1]) + ' ' +
      str(g[i][0][2]) + ' (' +
      g[i][0][0] + ") drawnode")
    if i%2 == 1:
        fout.write('\n')
    else:
        fout.write('  ')

genf("caps_draw_post.ps")
|
caps_path.pdf
caps_path.pdf
(Revision date: 2015-04-03.
Please use ISO 8601,
the International Standard.)
|